


Post-Silicon Validation Debugging Techniques: Tools, Methods, and Real-World Challenges
Navigate through this article using the table of contents below
Table of Contents
No headings found in this article.
A chip can pass extensive pre-silicon verification and still fail when powered on in the laboratory. A processor may crash under heavy workloads, a memory controller may behave unpredictably, or a peripheral may stop responding without an obvious cause. Finding the underlying problem requires systematic debugging.
Modern semiconductor engineers combine hardware instruments, software diagnostics, on-chip debug features, and structured failure analysis to identify these issues. Understanding how these techniques work helps engineers improve silicon reliability and prepare for real-world validation challenges.
Why Debugging Is Challenging After Silicon Manufacturing
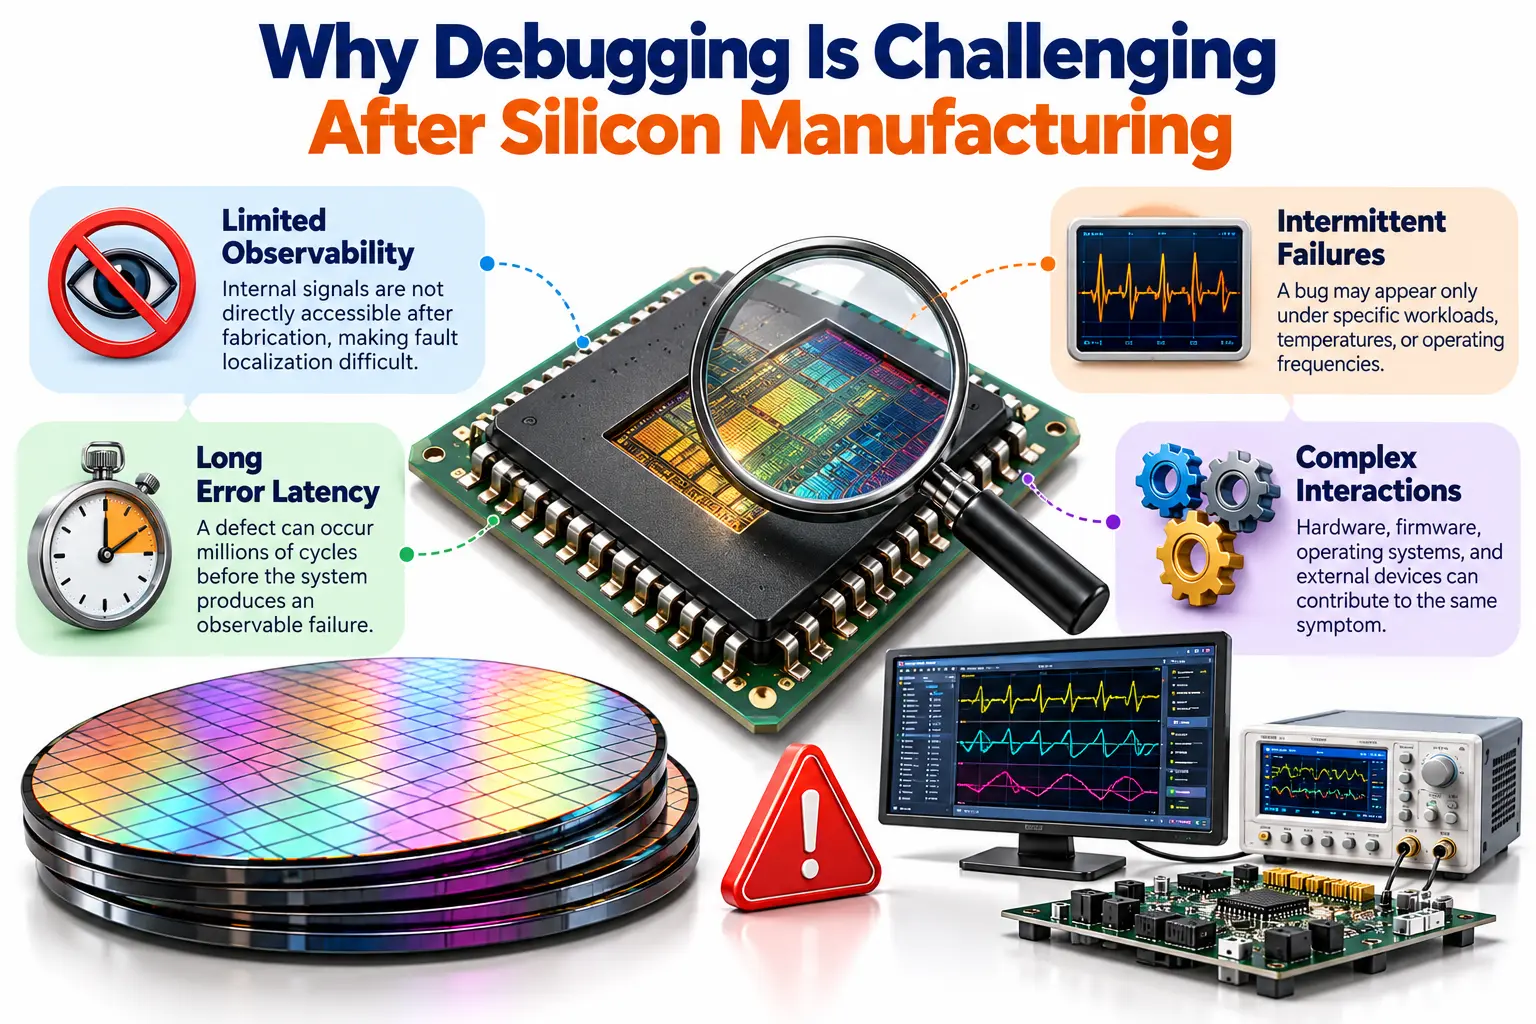
Debugging manufactured silicon is fundamentally different from debugging a simulated design. In simulation, engineers can inspect internal signals, examine waveforms, and trace signal transitions across clock cycles. Once a chip is fabricated, many internal signals are no longer directly accessible, making fault localization significantly more difficult.
Failures can originate from several sources, including RTL design defects, timing violations, power delivery problems, firmware errors, incorrect register configurations, and interactions between hardware and software. Environmental conditions, such as temperature and supply voltage, can also influence whether a failure occurs.
Engineers must therefore establish a repeatable debugging process rather than rely on guesswork. Important challenges include:
Limited observability: Internal signals may require dedicated debug logic or trace infrastructure to inspect.
Intermittent failures: A bug may appear only under specific workloads, temperatures, or operating frequencies.
Long error latency: A defect can occur millions of cycles before the system produces an observable failure.
Complex interactions: Hardware, firmware, operating systems, and external devices can contribute to the same symptom.
Identifying the first observable failure is only the beginning. The objective is to determine the original cause and develop evidence that supports a reliable corrective action.
Essential Tools Used for Silicon Debugging
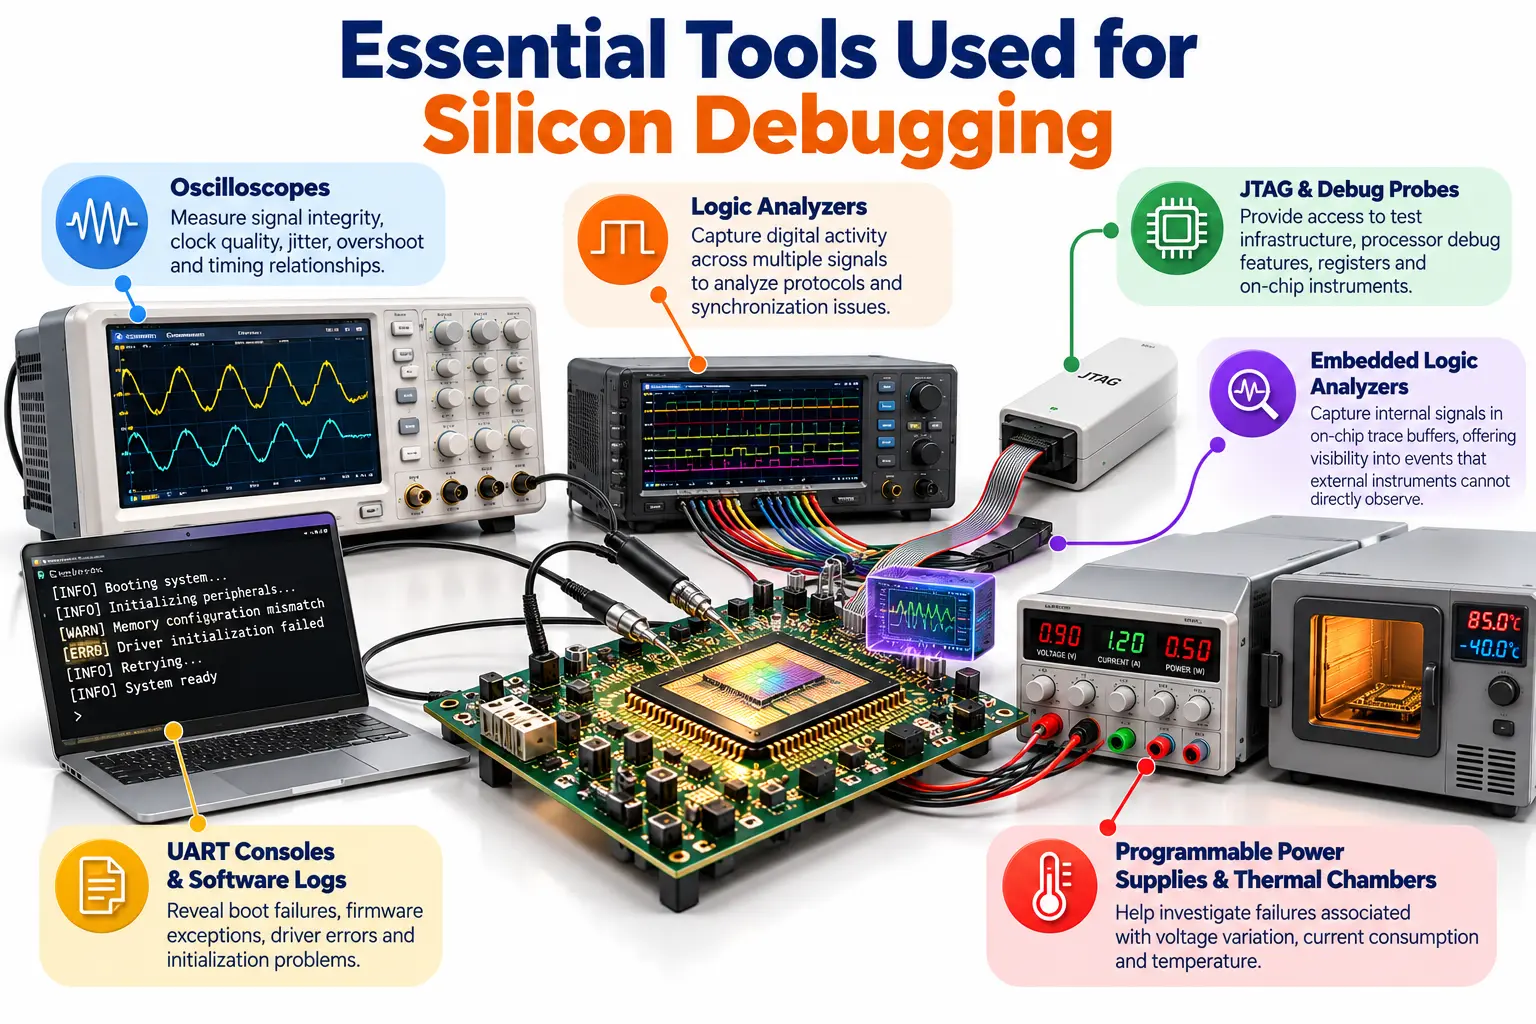
Effective debugging depends on selecting the right tool for the failure being investigated. Laboratory instruments help engineers observe electrical behavior, while software and on-chip debug facilities reveal system activity that external measurements cannot expose.
Commonly used tools include:
Oscilloscopes: Measure clock quality, signal transitions, overshoot, undershoot, jitter, and timing relationships. High-bandwidth probes and suitable measurement techniques are essential for high-speed interfaces.
Logic analyzers: Capture digital activity across multiple signals, helping engineers investigate protocol sequences, control signals, and synchronization problems.
JTAG and debug probes: Provide access to supported test infrastructure, processor debug features, registers, and internal instruments. Access depends on the chip architecture and security configuration.
Embedded logic analyzers: Capture selected internal signals in on-chip trace buffers, offering visibility into events that external instruments cannot directly observe.
UART consoles and software logs: Reveal boot failures, firmware exceptions, driver errors, and initialization problems.
Programmable power supplies and thermal chambers: Help investigate failures associated with voltage variation, current consumption, and temperature.
Automation tools are equally important. Python scripts, instrument-control interfaces, and register-access utilities can coordinate measurements and reproduce test conditions. JastTech can help aspiring semiconductor engineers build practical familiarity with validation workflows, debugging concepts, and laboratory-oriented problem-solving.
A Systematic Method for Root-Cause Analysis
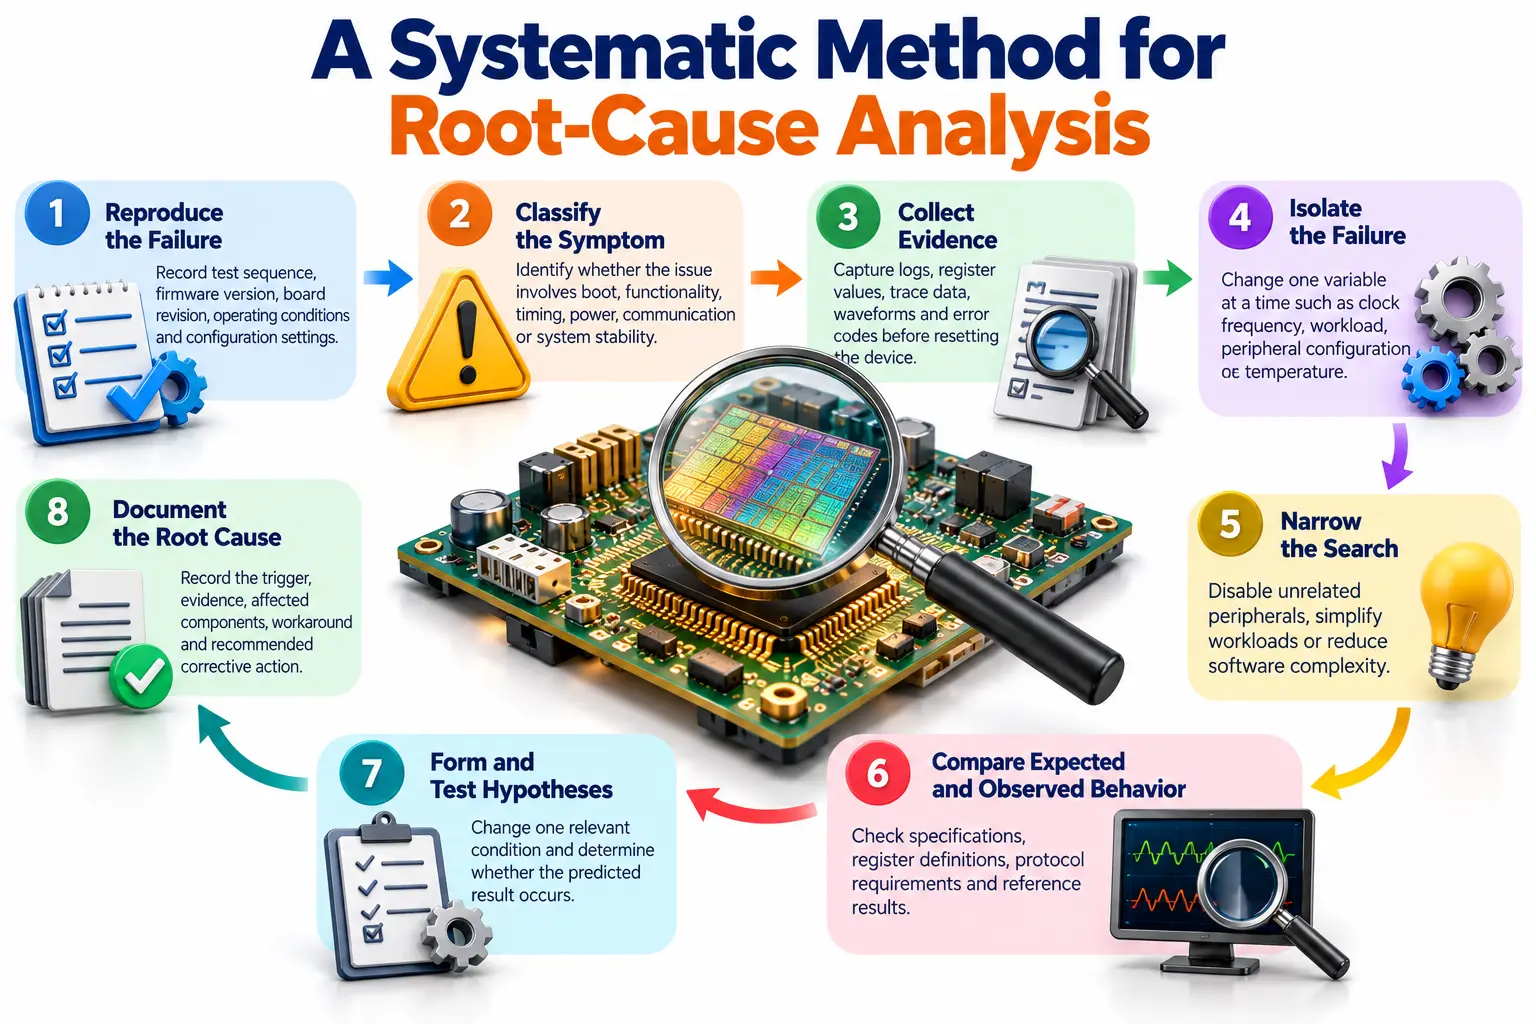
A structured debugging methodology prevents engineers from making premature conclusions based on symptoms alone. The process begins with a clear failure description and proceeds through controlled experiments until the evidence supports a root cause.
Start by reproducing the failure. Record the test sequence, firmware version, board revision, operating frequency, supply voltage, temperature, and relevant configuration settings. Establish a known-good baseline wherever possible. If the problem occurs intermittently, repeat the test and record its frequency of occurrence.
Next, isolate the failure using controlled changes. Modify one variable at a time, such as the clock frequency, workload, peripheral configuration, or temperature. This helps identify conditions associated with the failure without introducing unnecessary uncertainty.
A practical debugging sequence includes:
Classify the symptom: Determine whether the issue involves boot, functionality, timing, power, communication, or system stability.
Collect evidence: Capture logs, register values, trace data, waveforms, and error codes before resetting the device.
Narrow the search: Disable unrelated peripherals, simplify workloads, or reduce software complexity.
Compare expected and observed behavior: Check specifications, register definitions, protocol requirements, and reference results.
Form and test hypotheses: Change one relevant condition and determine whether the predicted result occurs.
Document the root cause: Record the trigger, evidence, affected components, workaround, and recommended corrective action.
When sufficient information is available, engineers can correlate silicon traces with RTL simulation or emulation. Reproducing the same transaction sequence in a pre-silicon environment may help identify the responsible logic, although analog effects and physical timing behavior may not be faithfully reproduced.
Debugging Functional, Timing, and Power Failures
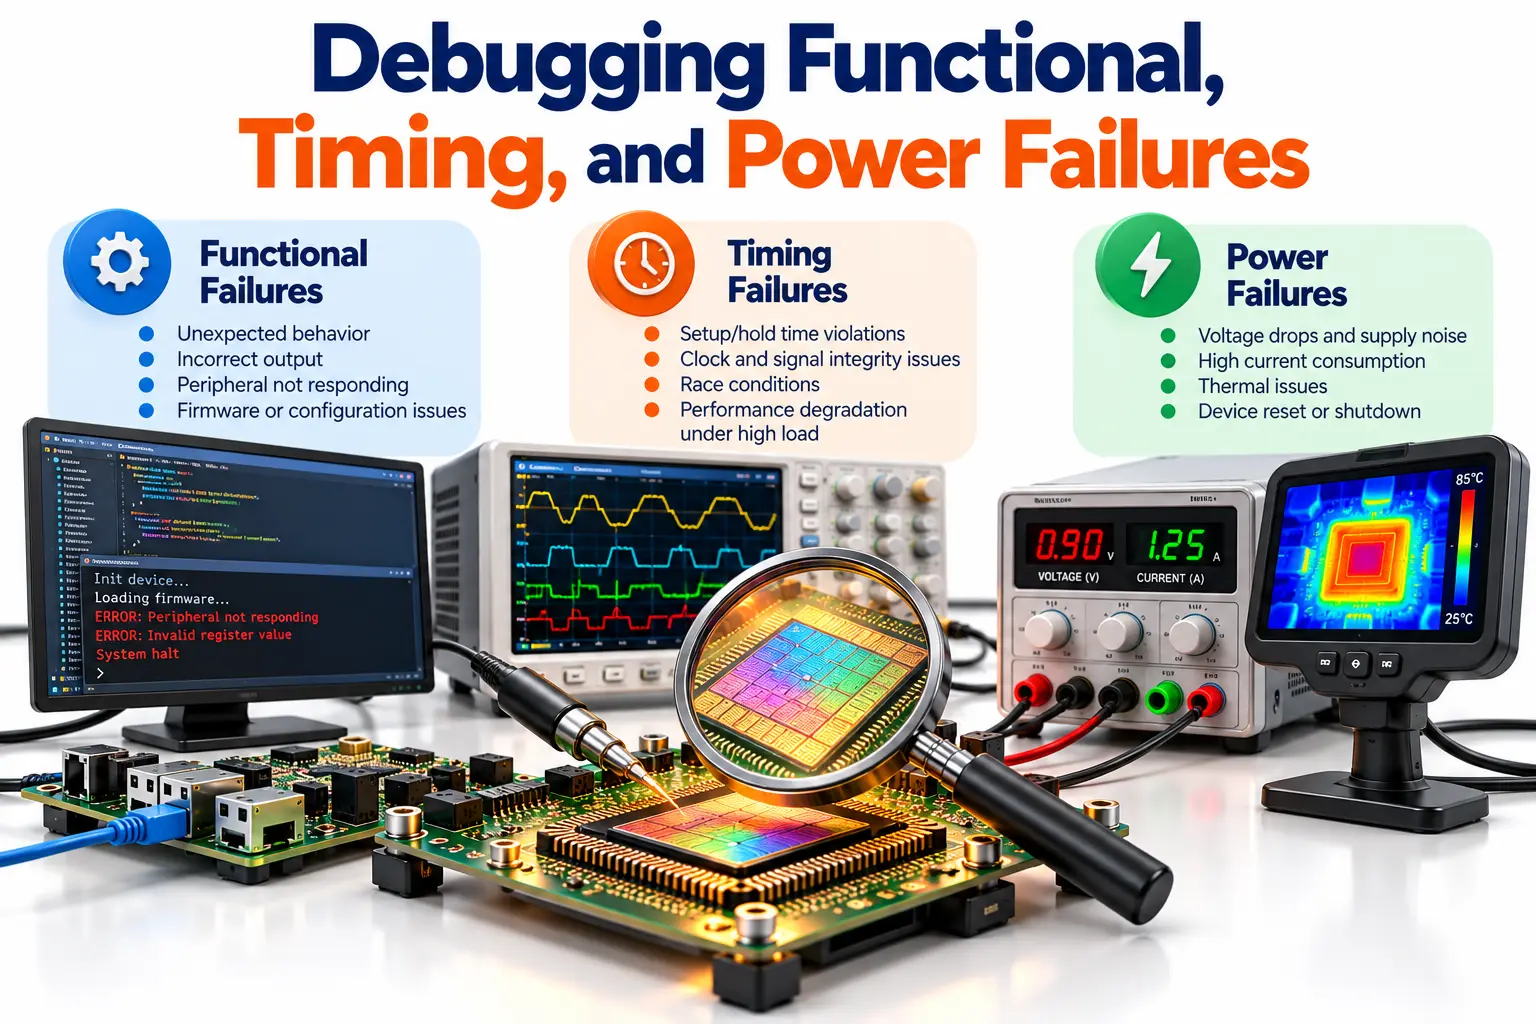
Different failure categories require different investigative methods. A functional failure may involve incorrect register values, protocol violations, or unexpected processor behavior. Engineers typically inspect transaction sequences, memory contents, interrupt handling, and firmware execution to identify where the observed behavior first diverges from expectations.
For example, if a peripheral fails to respond after initialization, the investigation might examine its clock, reset sequence, register configuration, and communication interface. An oscilloscope can confirm whether physical signals are present, while software logs and register reads can reveal whether the device completed initialization.
Timing failures require particular attention because a chip may function correctly at lower frequencies but fail when operating conditions become more demanding. Engineers can perform frequency sweeps, voltage-frequency testing, and controlled margin characterization to identify the conditions under which failures emerge.
Power-related investigations may include measuring rail voltage, current consumption, transient droop, and temperature. Engineers should also examine whether the failure correlates with simultaneous switching activity, workload intensity, or power-state transitions.
Useful debugging approaches include:
Frequency and voltage sweeps: Identify operating boundaries and potential timing-margin problems.
Thermal testing: Determine whether failures correlate with temperature changes.
Power measurements: Investigate supply instability, excessive current, and transient behavior.
Protocol analysis: Examine communication errors, missing responses, and incorrect transaction ordering.
Register-level diagnostics: Verify reset values, configuration sequences, status bits, and error indicators.
A failure that disappears at a lower frequency does not automatically prove a timing defect. Supply noise, firmware delays, signal integrity, and other correlated factors must also be considered.
Real-World Debugging Challenges and Practical Solutions
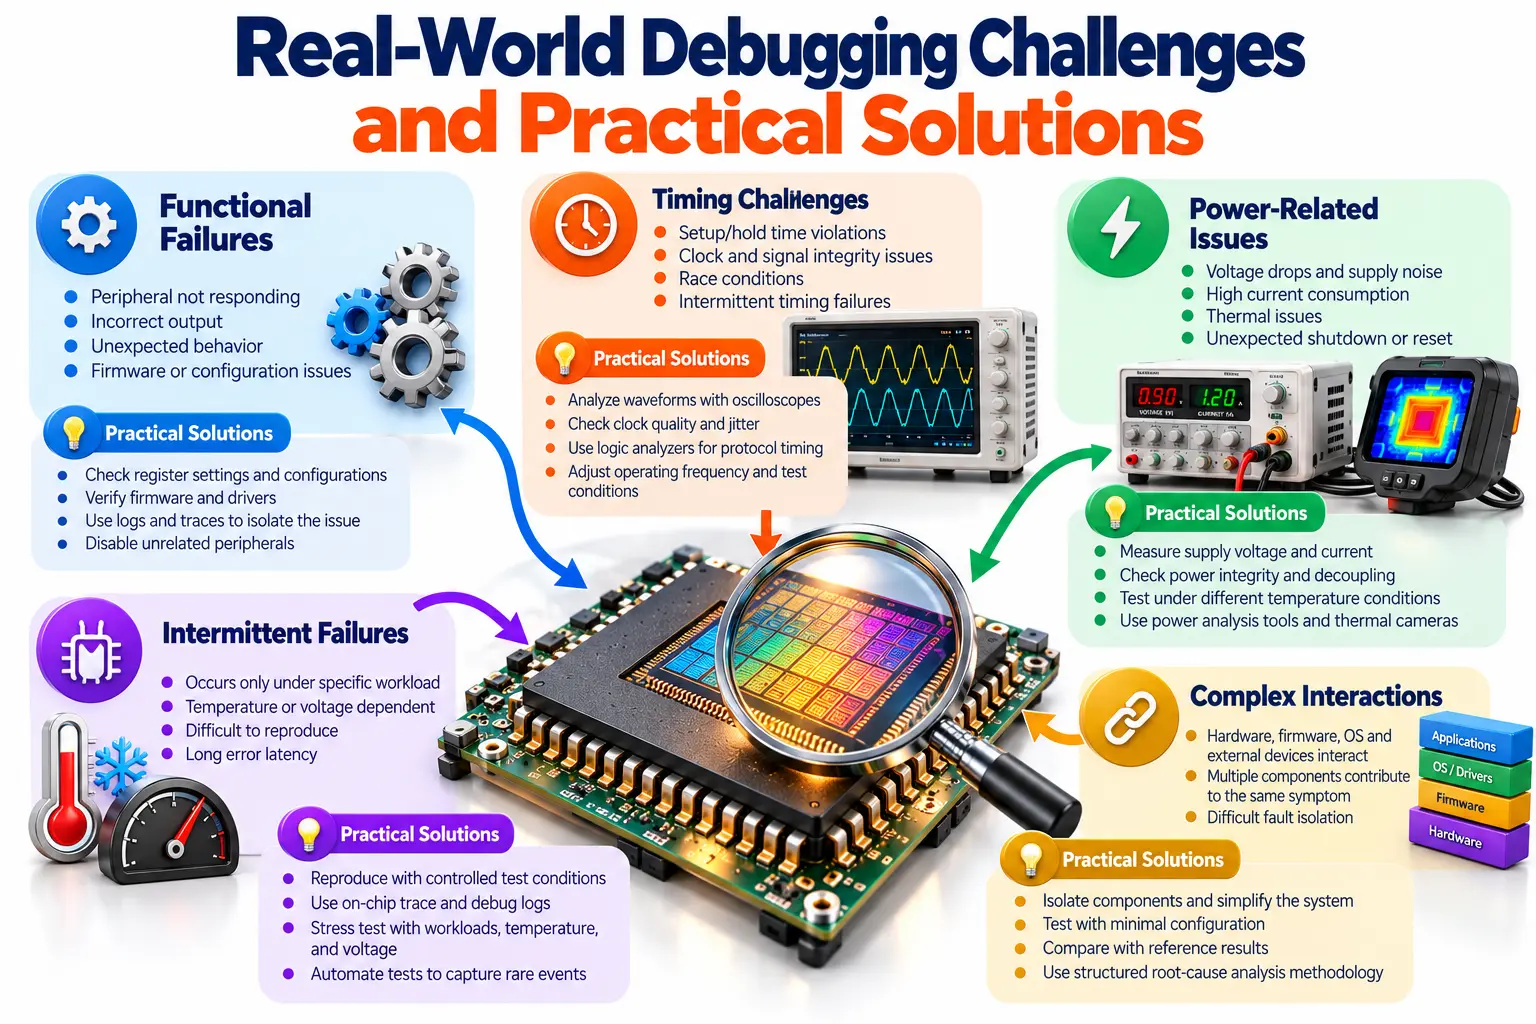
Intermittent failures are among the most difficult problems because the same test may pass repeatedly before failing unexpectedly. These failures can depend on narrow timing windows, asynchronous interactions, cache states, concurrent transactions, or environmental conditions. A simple pass-fail log rarely contains enough information to isolate the cause.
Engineers improve reproducibility by recording the complete test environment and automating the sequence that triggers the failure. Capturing a trace immediately before an error, preserving system state, and using deterministic workloads can make the difference between a useful failure report and an unrepeatable observation.
Another challenge is limited trace capacity. On-chip instruments cannot always capture every internal signal over long execution periods. Engineers must select signals strategically, configure trigger conditions, and prioritize the events most likely to distinguish competing root-cause hypotheses.
Hardware and software interactions introduce additional complexity. A processor exception may originate in a hardware defect, an invalid memory mapping, an incorrect driver sequence, or a race condition. Cross-functional collaboration helps engineers correlate processor traces, firmware logs, bus transactions, and electrical measurements.
Practical solutions include:
Automate regression tests and retain logs for every relevant configuration.
Use targeted triggers to capture evidence around the failure event.
Compare failing and passing runs to identify meaningful differences.
Maintain version-controlled firmware, test scripts, and instrument settings.
Introduce temporary workarounds carefully so they do not hide other defects.
Feed confirmed failures back into regression tests and pre-silicon verification.
These practices improve debugging efficiency while reducing the risk of overlooking related defects.
Building Industry-Ready Debugging Skills
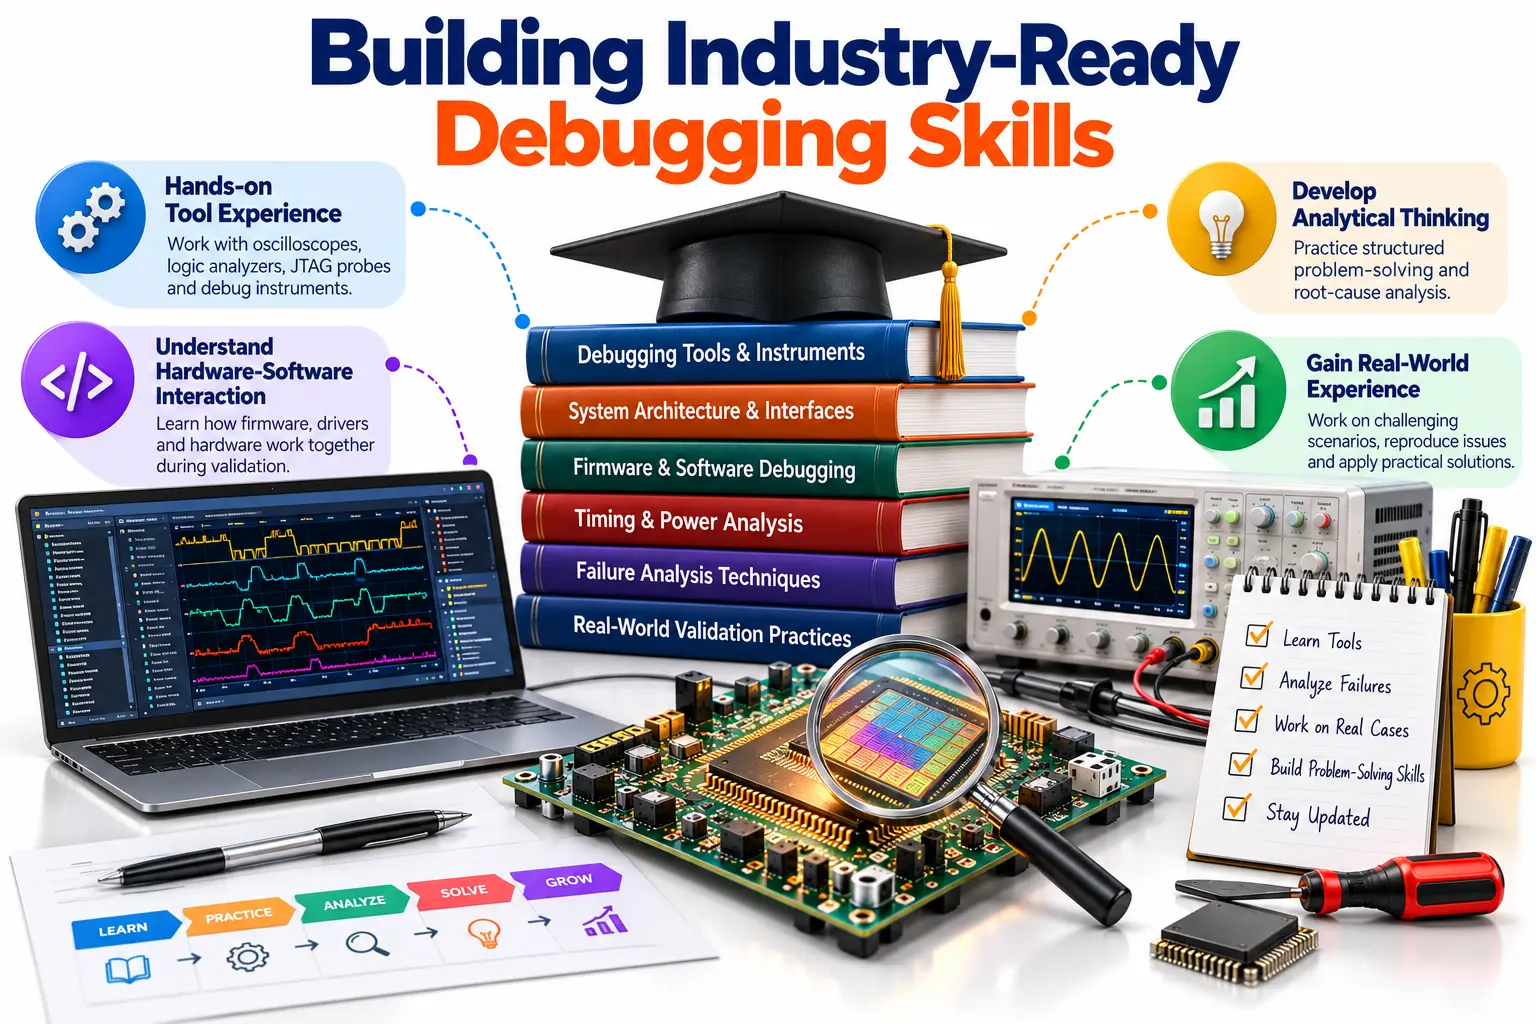
Successful silicon validation engineers need more than knowledge of digital logic. They must understand how hardware behaves in a physical environment, how software interacts with peripherals, and how to interpret measurements without confusing correlation with causation.
A strong learning path combines fundamentals with repeated hands-on exercises. Beginners can start by examining reset sequences, reading memory-mapped registers, analyzing UART output, and measuring basic digital signals. More advanced exercises can investigate interrupt failures, peripheral communication errors, clock-frequency sensitivity, and power-related instability.
For engineers pursuing Post Silicon Validation, practical preparation should include the following competencies:
Digital fundamentals: Understand clocks, resets, state machines, timing constraints, and interface protocols.
Programming and scripting: Use C for low-level diagnostics and Python for test automation, data processing, and instrument control.
Debug infrastructure: Learn JTAG, processor debug concepts, trace capture, and embedded instrumentation.
Laboratory techniques: Interpret oscilloscope measurements, power readings, and logic-analyzer captures.
Failure analysis: Reproduce problems, develop hypotheses, isolate variables, and document evidence.
Regression discipline: Convert confirmed failures into repeatable tests that detect future regressions.
JastTech can support learners who want to strengthen their semiconductor fundamentals and develop a practical understanding of validation and debugging workflows. Combining technical knowledge with disciplined experimentation helps engineers become more effective when working with real silicon.
Conclusion
Silicon debugging requires a combination of systematic investigation, appropriate instrumentation, software diagnostics, and sound engineering judgment. Limited observability, intermittent failures, electrical variations, and complex hardware-software interactions make it essential to reproduce problems, collect meaningful evidence, and test hypotheses methodically. No single instrument or debugging technique can solve every failure.
Engineers who develop strong fundamentals, practice laboratory measurements, automate test sequences, and document root causes are better prepared for semiconductor validation responsibilities. With practical learning, structured problem-solving, and continuous improvement, aspiring engineers can build the skills needed to investigate difficult chip failures and contribute to more reliable semiconductor products.